Home > Blog > How to Verify Fuel Tanker Delivery Volume at a Gas Station
How to Verify Fuel Tanker Delivery Volume at a Gas Station
Accurate monitoring of unloading volume is crucial for tanker truck deliveries to gas stations, as well as trade transfers and distribution. Data from before, during, and after delivery should be precisely correlated, at least within permissible margins.
So, how do you calculate the delivery volume of tanker trucks to gas stations? Where do gaps typically occur? We’ll share three methods for checking unloading volume and why temperature is often the cause of most “shortfalls.”
The discrepancy between the Bill of Lading (BOL) and the tank readings can stem from three main sources: temperature, metering errors, and transportation losses.
Temperature. Petroleum products expand and contract with temperature changes. Fuel leaves the depot at a higher temperature and arrives at the station at a lower temperature, and vice versa. Therefore, a shipment that shows as 30,000 liters on the depot shelf will have a different actual volume after entering the underground tank. The fuel itself is not lost; only the volume has changed. This is the most common reason why deliveries appear to be short.
Level gauge errors. Most gas stations measure the tank level before and after it drops, then convert the level change to volume using the tank’s calibration chart to confirm the amount of fuel added. The problem is that level gauges on horizontal underground tanks can shift over time due to factors such as installation tolerances, foundation settlement, and tank deformation. If the level gauge is faulty, all checks based on it will also be incorrect.
Transportation losses. Sometimes, fuel is indeed lost during transit. These circumstances are sufficient grounds for a dispute, and the only way to prove the dispute is to independently measure the actual amount of oil that entered the tank.
Method 1 — Fuel Tank Level Gauge
This is the default method for most sites: comparing fuel tank levels before and after unloading.
Before unloading, record the initial fuel tank level. After the fuel settles, measure it again, then convert the difference between the two measurements to volume based on the fuel tank level gauge reading. Finally, compare this volume value with the Bill of Lading (BOL).
This method is convenient, quick, and cost-free, sufficient for routine inventory tracking. However, it has several limitations as proof of delivery:
It relies entirely on the fuel tank level gauge reading, which changes over time.
It lacks temperature correction, so temperature differences and actual shortages appear identical.
Fuel tank level gauges themselves have measurement errors, typically around 0.5% accuracy.
Furthermore, according to the U.S. Environmental Protection Agency (EPA), manual measurement of fuel tank level gauges is only acceptable for tanks under 2000 gallons; larger capacity sites must use automatic level gauges. Routine checks are acceptable. However, to resolve disputes or correct charts, a measurement method that is completely independent of the fuel tank is needed.
Method 2 – Measuring the Unloading Line
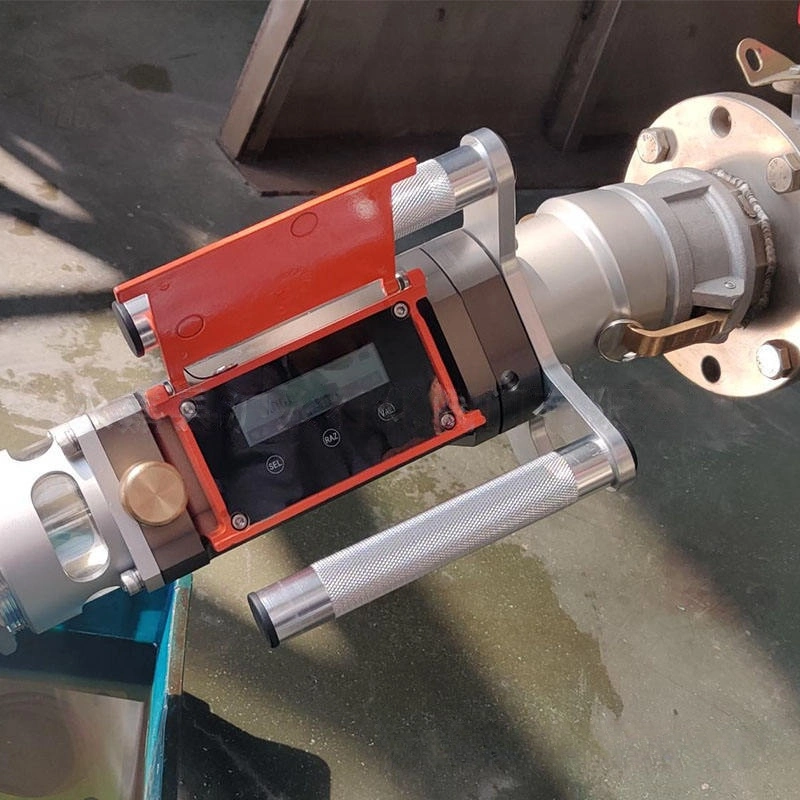
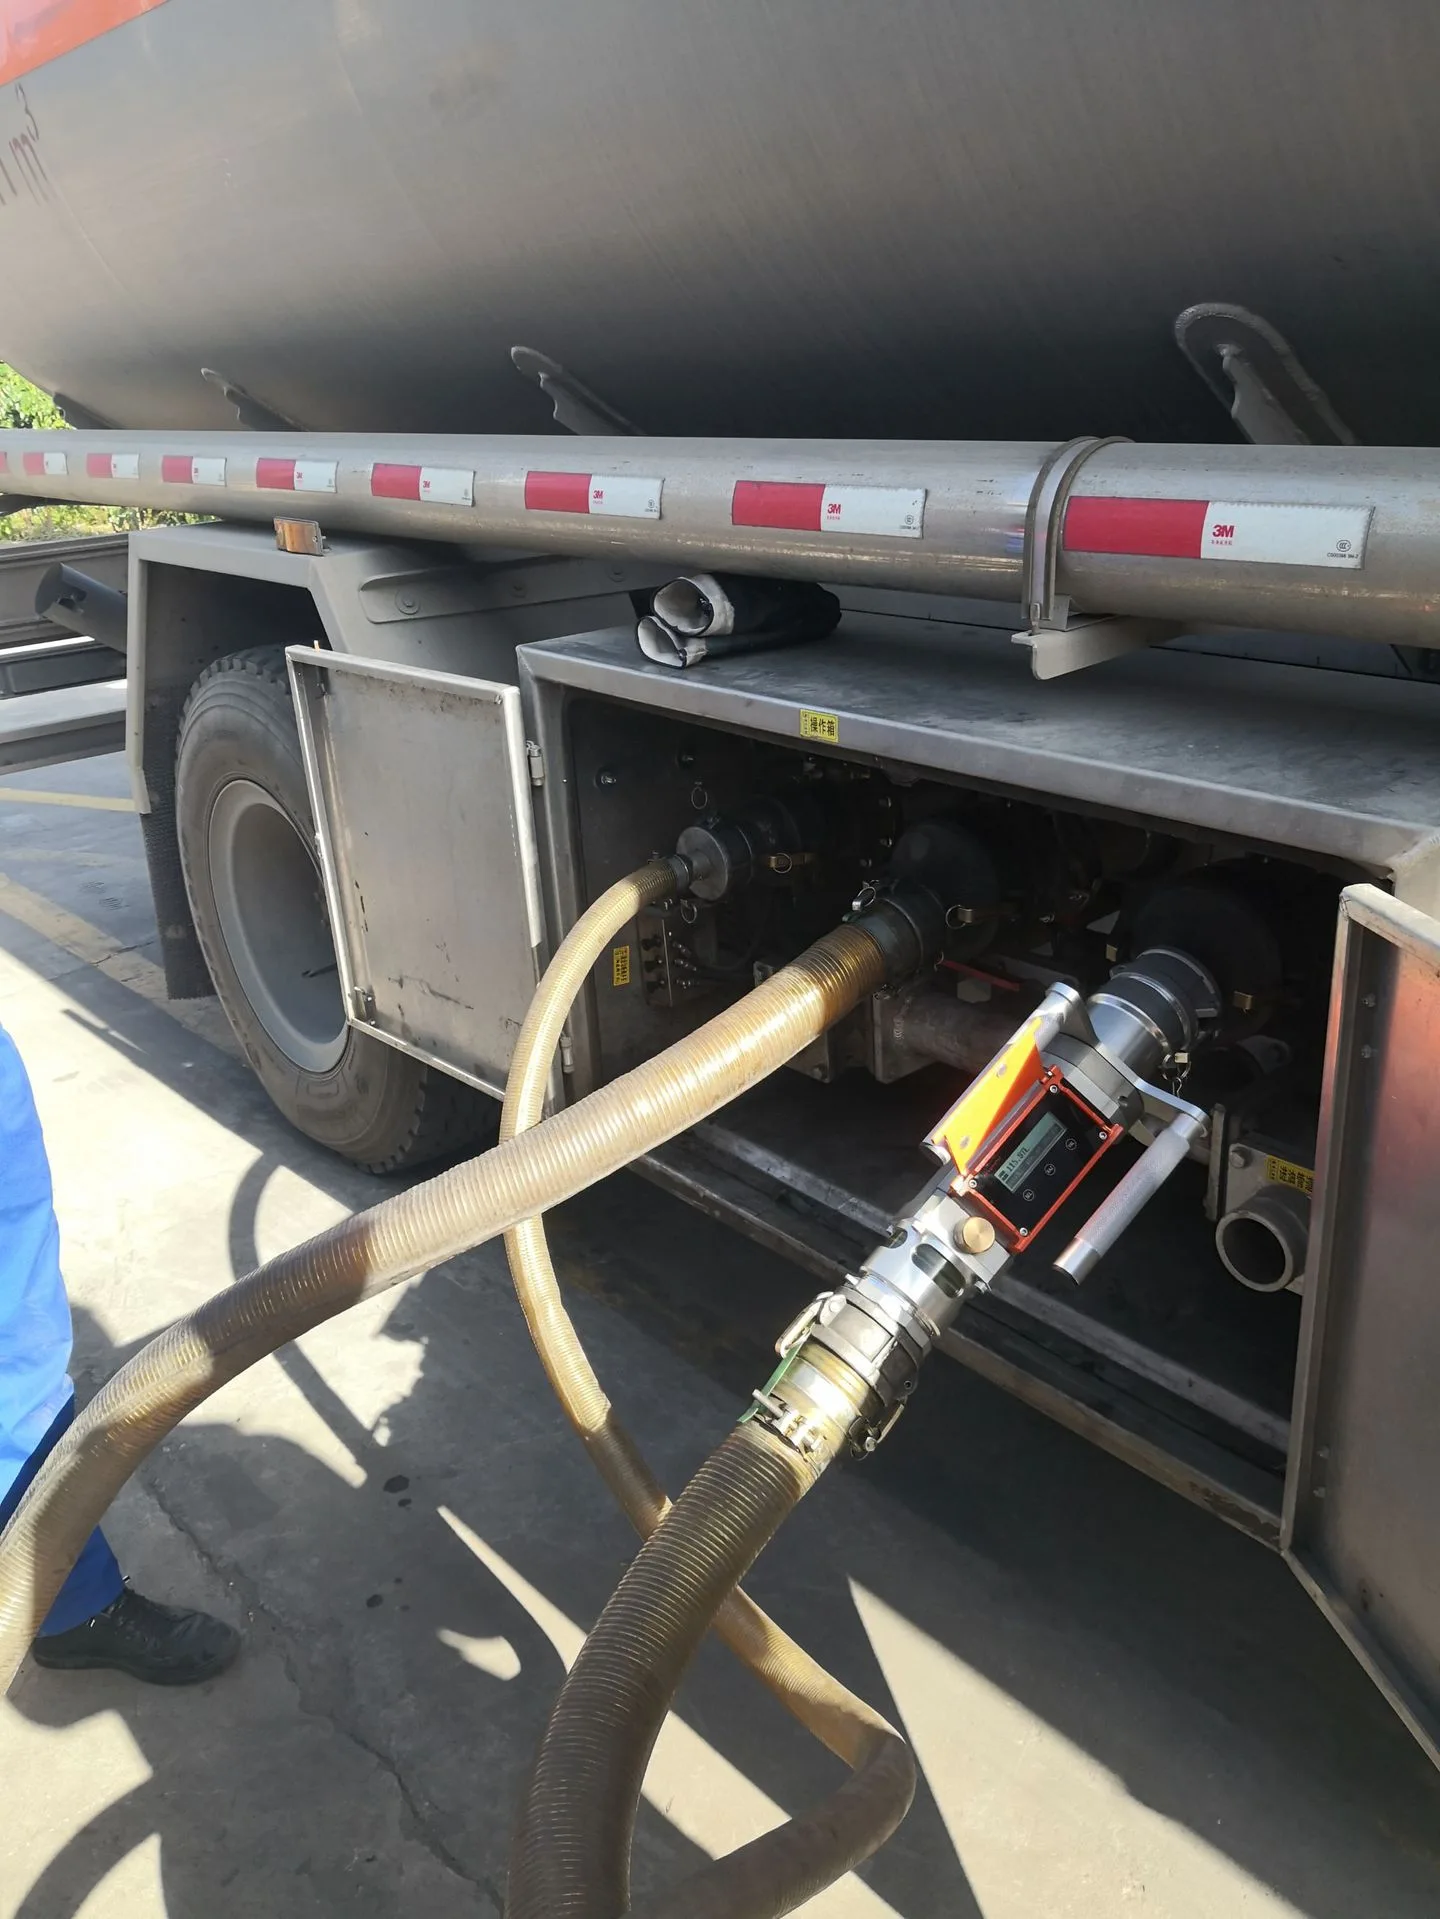
The most direct way to determine the unloading volume of a tanker truck is to use a flow meter unaffected by the tank or level gauge to measure the fuel flow rate.
Place a portable flow meter into the unloading line to read the actual amount of fuel flowing into the tank. It is located between the tanker truck outlet and the refueling port. Connected via a quick-connect coupling, it measures the entire unloading flow rate without any modifications to the pipeline.
The coupling must match the tanker truck outlet. For example, a diesel customer using a digital diesel flow meter on their unloading line might have a 2 1/2 inch (65 mm) outlet on their tanker truck; therefore, the flow meter would be equipped with a 2.5-inch quick-connect coupling, while a 3-inch outlet would require a 3-inch coupling. This is a small detail that determines whether the connection is quick and leak-free, and it’s something we check first before providing a quote.
Simultaneously measure two data points: total flow rate and fuel temperature, so the meter can report the corrected (net) flow rate. This data can be used for verification in case of future disputes.
Method 3 — Use the flow meter to fix your tank chart
Metering a drop settles one delivery. It also gives you something more useful over time: a trustworthy reference volume you can turn around and use to check the tank’s calibration chart, or validate the ATG.
Meter a handful of deliveries, compare each metered volume against the level change your chart predicts, and the chart error shows itself. Correct the chart against those metered references and your routine dip and ATG checks become reliable again, because the numbers underneath them are finally true. Most stations never do this, which is why the same phantom shortage keeps coming back month after month.
Why temperature settles most of these arguments
The idea that ends most delivery disputes is simple: you can’t fairly compare two volumes measured at two different temperatures.
The terminal bills you on a net standard volume, the volume corrected to a fixed reference temperature. In the US that reference is 60°F; much of the rest of the world uses 15°C. The correction itself uses a Volume Correction Factor (VCF), the method set out in API MPMS Chapter 11. Multiply the gross observed volume by the VCF and you get the net standard volume.
Here is what that looks like in practice. Diesel changes volume by roughly 0.08% for every 1°C. If a load leaves the terminal about 15°C warmer than the fuel sitting in your tank, that is close to 1.2% of volume. On a 30,000-litre delivery, around 350 to 400 litres can appear to be missing. None of it was lost. It contracted. Compare your gross figure to the terminal’s net figure and you will see that “shortage” every time. Correct both to the same reference temperature and it usually disappears. A meter that records temperature and outputs the net volume removes the argument before it starts, because both sides are finally counting the same way.
If you work to the Chinese GB standard, the same idea shows up as “V20”, corrected to 20°C. For deliveries reconciled against US or international BOLs, correct to 60°F or 15°C so your number matches the terminal’s.
A workflow you can run
Connect a portable meter into the unloading line with a quick coupling matched to your tanker outlet (for example, 2 1/2 in / 65 mm). No tools, no line changes, no effect on unloading speed.
Meter the unloading. Let the full drop run through; the meter totals the gross volume and logs the fuel temperature.
Record both numbers, the gross and the temperature-corrected net.
Compare the net volume to the dispatch note, on the same temperature basis.
Save the metered record so a later dispute is settled with data.
Every so often, use those metered volumes to check and correct the tank chart or ATG.
Run consistently, this turns “I think we got shorted” into a figure you can put in front of a supplier or an auditor.
FAQ
Yes. Fuel expands and contracts with temperature, so the same fuel is a different number of litres at different temperatures. Diesel moves about 0.08% per °C. That is why deliveries are billed on net standard volume, corrected to 60°F or 15°C, rather than on gross volume.
In a turbine meter, fuel spins a rotor whose speed is proportional to flow velocity, and the electronics convert that into a totalised volume. It suits clean, low-viscosity fuels like gasoline, diesel and kerosene, which is exactly what a tanker drop is.
For deliveries, in-line meters are the right choice because they give the accuracy and repeatability a dispute depends on. Clamp-on ultrasonic is convenient for quick surveys but generally isn’t accurate enough for custody-style checks.
Net standard volume is the fuel volume corrected to a standard reference temperature (60°F or 15°C) using a Volume Correction Factor, as defined in API MPMS Chapter 11. It lets you compare your delivered volume to the terminal’s billed volume on the same basis.
To select the appropriate flow meter for your unloading line, please inform us of your tanker truck outlet size, the type of fuel you handle, and your typical unloading flow rate, and our engineers will confirm the configuration.
Gravity flow meters can be used to measure flow in gravity-fed pipelines. These pipelines typically do not have a pressurized pump. Instead, the fluid flows downward from a height, relying on gravity. This type of measurement is often difficult due to the slow flow rate and low flow rate. In our experience, if the fluid … Read more
Opting the right Boat Fuel Flow Meter and properly installing it can significantly enhance maritime transport efficiency and safety. By knowing the various types of fuel flow meters available and following best practices for installation, you can effectively monitor fuel consumption and optimize performances. With this blogpost, you’re now equipped to select the best fuel … Read more
At the core, a ‘Digital Fuel Flow Meter’ is a device used to measure the amount of fuel flowing through a system. It provides valuable data on fuel consumption rates, which can be used to analyze efficiency, monitor fuel costs, and detect anomalies or inefficiencies within a fuel system. There are several types of flow … Read more
Marine fuel flow meters are crucial for all industrial marine applications, helping to keep fuel consumption in check and efficiency at its peak. In an industry where every drop of fuel counts, a reliable marine fuel flow meter is not just a tool – it’s a necessity. To monitor and manage your vessel’s fuel usage … Read more
Every drop counts when it comes to fuel. Precise fuel management is a critical need in various industries, be it aviation, marine, automotive, or oil & gas. And, the device at the heart of it all is the fuel flow meter. For those looking for an ideal fuel flow measurement solution, this guide will help … Read more
Nitrogen Flow Controllers are devices specifically designed for measuring and controlling nitrogen flow. They not only measure the volumetric or mass flow rate of nitrogen, but crucially, they also control the flow rate. Generally, they are based on a nitrogen flow meter, with the addition of an automatic control valve and a closed-loop control system. … Read more
Zhang Wei, possesses 20 years of experience as an automation instrumentation engineer, specializing in the research, design, installation, commissioning, and maintenance of automation instruments.
Face to various instrument communication protocols (such as Modbus, Profibus, etc.), with solid hardware circuit design and software programming skills (proficient in C language and PLC programming). Has extensive project experience; projects he has led and participated in have all achieved outstanding results, improving product accuracy, reducing costs, and increasing production efficiency.
Possesses excellent communication and coordination skills and a strong team spirit, enabling him to quickly respond to customer needs and provide high-quality automation instrumentation solutions.