
3D Radar Level Scanner for Silos
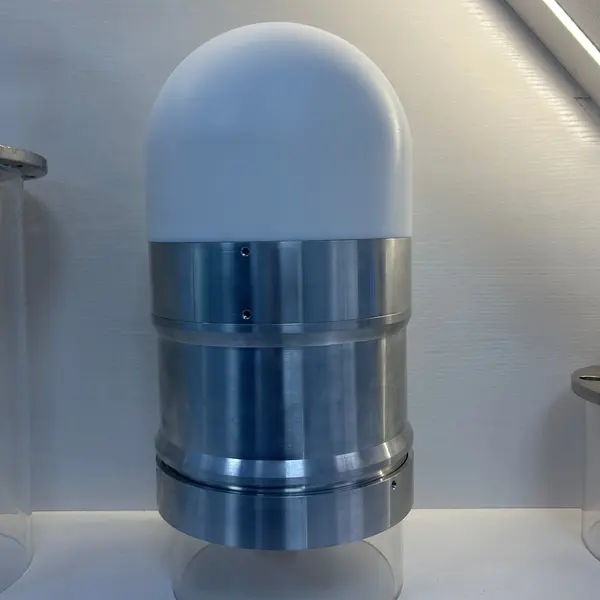
The 3D radar level scanner accurately detects the three-dimensional information of solid materials in silos. Based on 80–140 GHz frequency modulated continuous wave (FMCW) radar, the radar sensor is driven by a rotating and pitching structure to perform a 360° high-resolution scan of the material surface. It generates a 3D visualization image and calculates material level, volume and weight.
Measuring radius: ≤40 m. Volume accuracy: ≤±2%–3% of full range. Beam angle: 1.5°. Mounting: DN200 opening on the silo roof. Power supply: 24 VDC / 220 VAC.
Working Principle
Because solid materials in silos tend to form an angle of repose, there is a large difference in material level across the surface. A traditional single-point radar level gauge cannot accurately reflect the true shape inside the silo, regardless of its installation location. Single-point radar, such as our 80 GHz radar level sensor, gives one distance; the 3D scanning radar measures the whole surface.
The horizontal rotating structure rotates continuously in one direction, unlike traditional reciprocating rotation. This improves the scanning speed, shortens the refresh cycle and extends the service life of the mechanical parts.
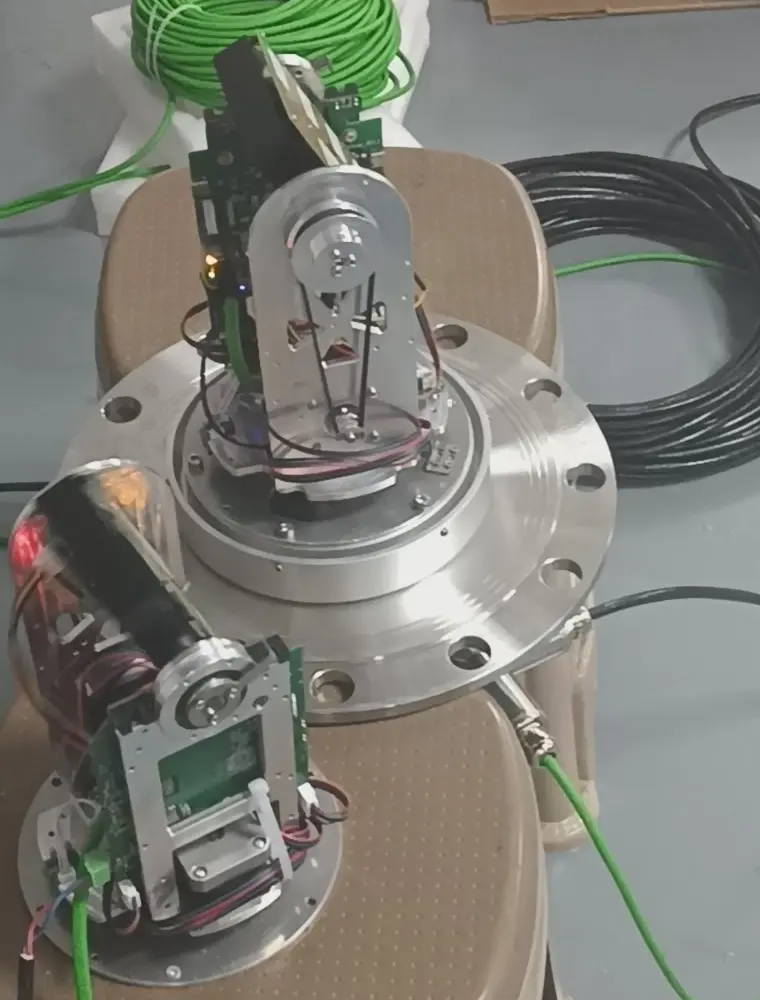
At each preset angle the radar measures the distance to the material surface (see our radar level transmitter working principle for FMCW ranging). The measurement data is then processed in these steps:
- 3D point cloud acquisition.
- Cropping and segmentation, transformation processing.
- 3D modeling of the material surface.
- Calculation of volume, mass, highest material level, lowest material level and average material level, using the density value provided by the customer on site.
- Database, reports and web page display.
Product Features
3D imaging visualization
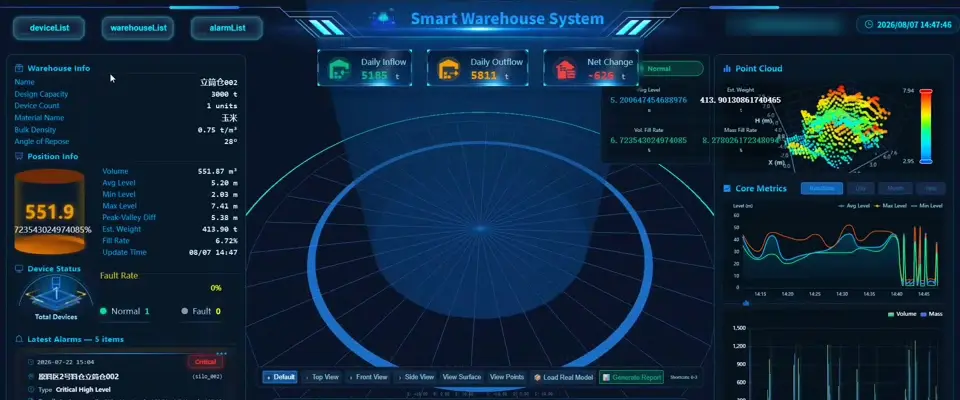
The 3D scanning radar scans the surface of the material. After processing by the algorithms on the server, it obtains accurate three-dimensional information and builds a 3D model, so that the actual shape of the material surface is reproduced on the interface as a 3D visualization image.
High calculation accuracy
The processing algorithm uses terahertz radar signal multi-dimensional super-resolution reconstruction. 3D modeling uses precise fitting, noise removal, and material cutting and segmentation to improve calculation accuracy.
Inventory system replaces manual inspection
From the three-dimensional information, the system obtains material level, volume and mass. This prevents material overflow and gives real-time purchase, consumption and inventory data. Measurement intervals are set according to actual needs, and inventory checks are performed automatically.
Real-time dynamic monitoring
Real-time measurement of the material surface and silo wall shows the material distribution inside the silo and whether material is hanging on the wall. This helps prevent structural damage or silo collapse caused by material collapse or uneven distribution, avoids wrong inventory figures caused by wall build-up, and provides a reference for timely silo emptying. 24/7 automatic detection requires no manual intervention, so operators do not need to work in harsh environments.
Multi-radar stitching for large storage
For ultra-large silos, dome silos and large open silos, two or more 3D scanning radars are installed to cover the whole measurement area. The stitching and registration algorithm combines the data from each radar and presents the entire area in a single 3D view. The radar can shield unimportant areas. The antenna cover has a sealed, dust-proof design and does not accumulate dust; the high-temperature wave-transmitting material reduces radar wave attenuation.
Software system and remote monitoring
The software connects with modules such as ERP and presents results as 3D visualization images and data reports. Measurement data can be sent to a cloud server, which stores historical data and supports monitoring and control from multiple terminals and locations. Desktop computers, laptops, LCD display screens, mobile phones and tablets can display the 3D images, material level, volume and mass. A Bluetooth app on an Android phone or tablet can debug the radar on site without climbing the tank.
Technical Parameters
| Operating frequency | 80 GHz–140 GHz frequency modulated continuous wave radar (FMCW) |
| Material type | Particles, powders and other bulk solids |
| Measuring radius | ≤40 m |
| Volume accuracy | ≤±2%–3% full range |
| Data communication | Ethernet / fiber optic / 4G / 5G |
| Horizontal angle | 360°, continuous rotation |
| Beam angle | 1.5° |
| Pitch measurement angle | -90° to 90° (adjustable) |
| Housing material | Cast aluminum + PTFE |
| Output data | PCD (other methods can be customized) |
| Heavy dust | Unaffected |
| Process temperature (standard) | -25 ℃ to 75 ℃; higher with cooling accessories |
| Process pressure | 0.1 bar (higher can be customized) |
| Power supply | 24 VDC / 220 VAC |
| Maximum power | 12 W |
| Protection level | IP67 |
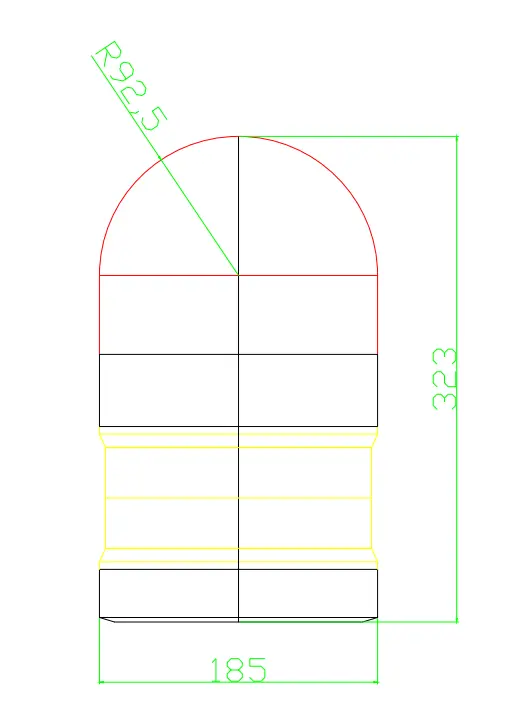
| Dimensions | Ø185 mm × 323 mm |
System Block Diagram
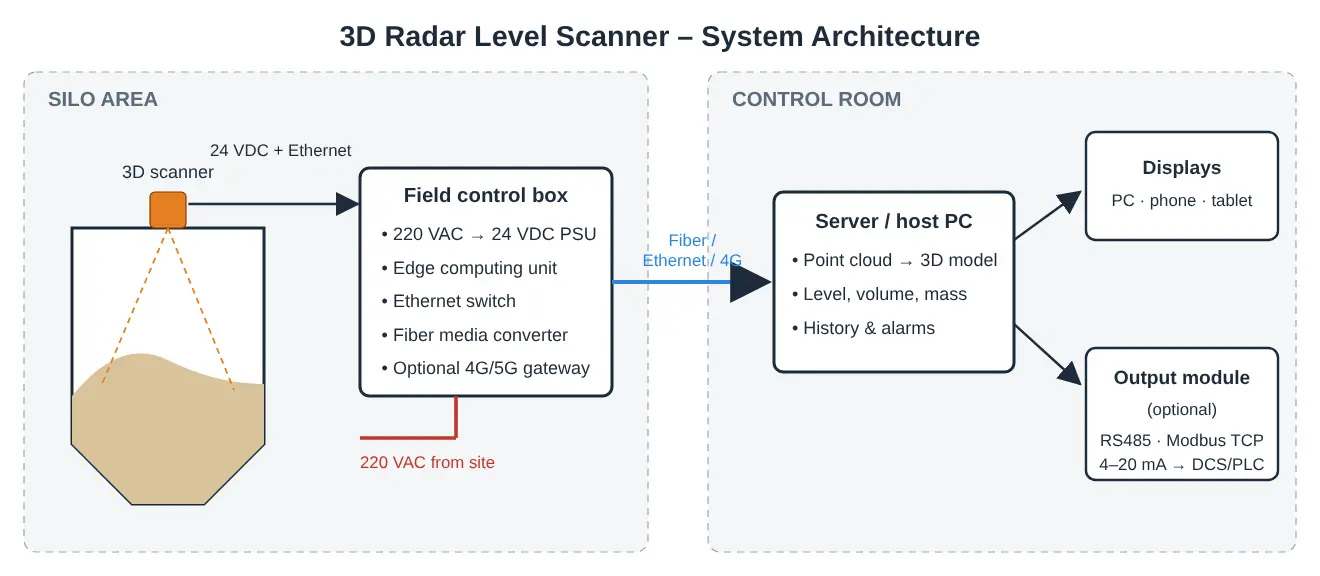
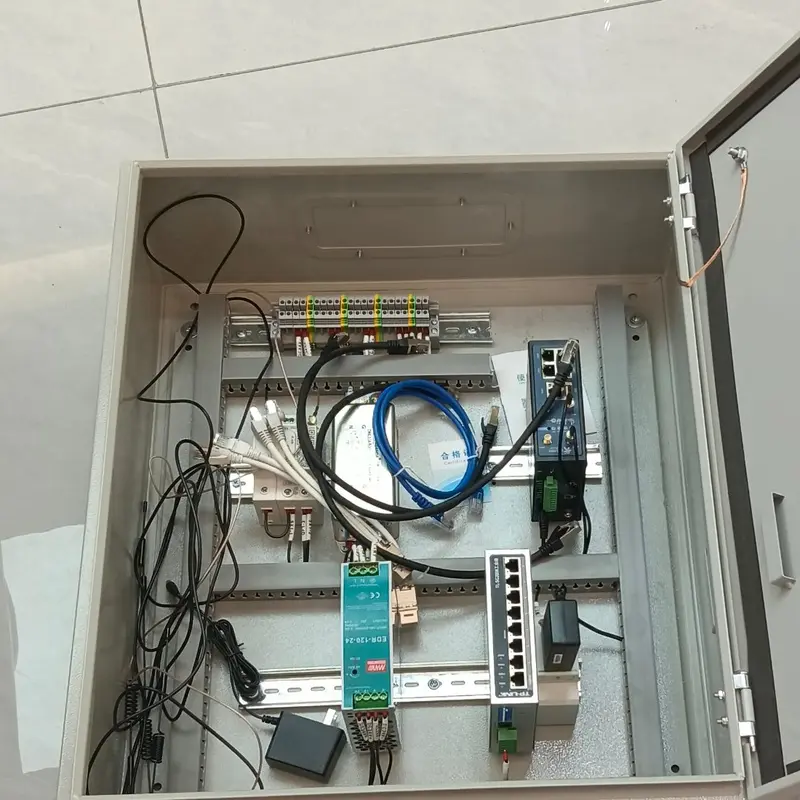
The electrical control box is mounted on the silo top. The site provides 220 V power to the control box, and the power module inside converts it to 24 VDC for the 3D scanning radar. After each detection cycle, the radar sends the measurement data to the control box through a network cable. The data computing unit in the control box processes the data and outputs it via Ethernet; the photoelectric converter then transmits it through optical fiber to the central control room. The server in the control room generates the 3D image and displays material level, mass and volume.
Output modules are optional. They send the material level and other values calculated by the server to the customer’s other control systems. If an output module is required, please confirm the signal type (RS485, MODBUS TCP or 4…20 mA) and the output parameters.
Installation Location and Installation Plan
The 3D radar is installed on the top of the silo through a DN200 opening, at about 1/4 of the silo diameter. The opening is at least 2 m away from the feed inlet, to reduce the influence of material flow during feeding.
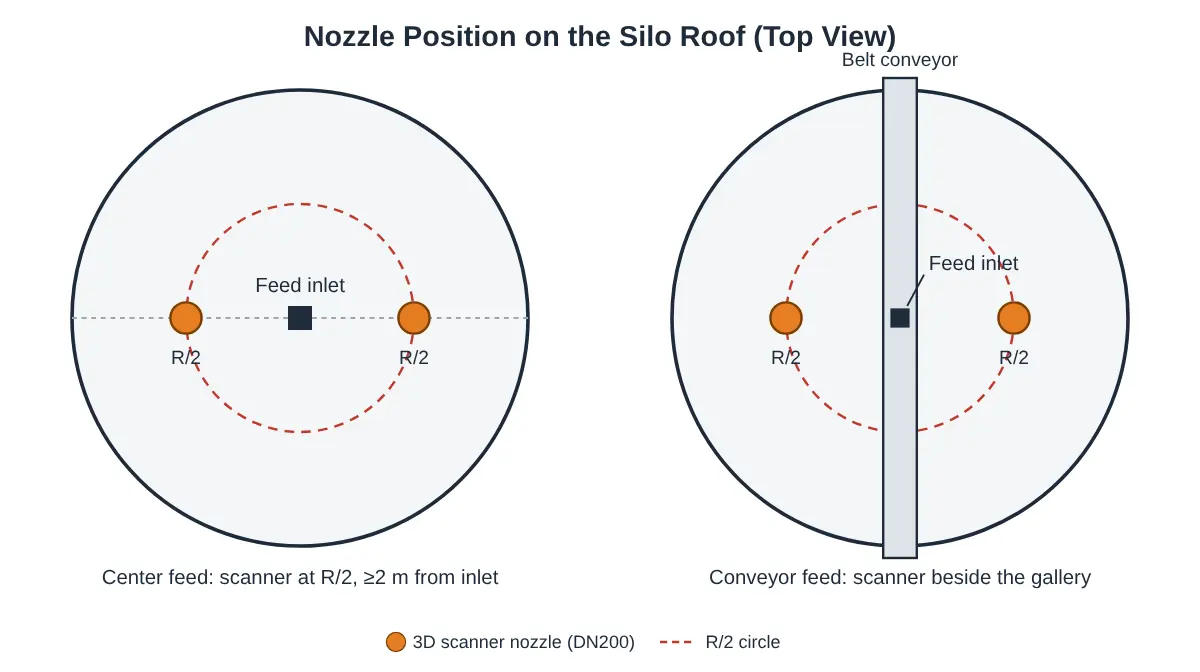
- Directly below the opening and within 45°, avoid thick or large beams and other obstacles, to prevent interference signals that affect detection accuracy.
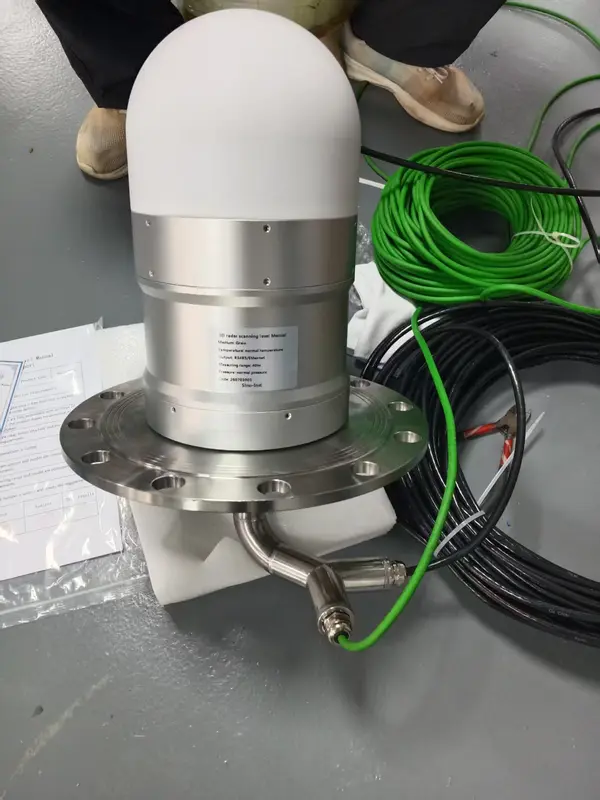
- The instrument flange is bolted directly to the silo top. Mark the bolt hole corresponding to the flange zero point and its direction.
- If the 3D shape of the material surface is used to guide feeding and discharging, please provide more site information, such as the location of the feed inlet and the feeding method, to determine the number and location of radars.
Number of Scanners by Silo Type
| Silo type | Typical capacity | Typical size | Radar mounting height | Radars per silo |
|---|---|---|---|---|
| Vertical silo | 3000 t | Ø15.584 m, eave height 18 m, cone roof | 21.258 m | 1–2 (center / off-center) |
| Shallow round bin | 5000 t | Ø25 m, eave height 8 m, cone roof | 12.5 m | 2–4 |
| Flat warehouse | 5000 t | 48 m × 24 m, eave height 6 m, gable roof | 8.5 m | 2–6 |
Material parameters such as bulk density and angle of repose vary with material type, origin and moisture content, and need on-site calibration. For simple high/low alarms in small bins, see our powder level switches, and for other options our bin level measurement guide.
Bill of Materials per Unit
| No. | Component | Qty | Remark |
|---|---|---|---|
| 1 | 3D scanning radar | 1 unit | Includes power and communication cable |
| 2 | Host computer software | 1 set | |
| 3 | Electrical control box | 1 set | Network module + power module + computing unit |
| 4 | Network cable | 1 set | Length according to site conditions |
| 5 | 24 V power cable | 1 set | Length according to site conditions |
| 6 | Instrument flange | 1 pc | Includes screws, nuts and washers |
On-site installation, roof opening, fiber laying and splicing, and power and network cable laying are done by the user. We provide installation guidance.
Applications
The 3D scanning radar uses a narrow beam with strong penetration. It is not affected by high temperature, heavy dust, corrosion, steam, rain or fog, and is used for solid materials in silos, containers and bulk material warehouses. See also our bulk solids level sensor guide.
| Industry | Silos |
|---|---|
| Grain | Flat warehouses, shallow round bins, vertical silos, star bins |
| Thermal power | Raw coal silos, fly ash silos, gypsum silos, desulfurization limestone silos |
| Coal | Raw coal silos, coal blending silos, coal stockpiles |
| Cement | Raw meal silos, clinker silos, homogenization silos, finished product silos |
| Steel | Coking coal, sintering plants, blast furnace material level |
| Metallurgy | Iron ore, lime, carbon powder, aluminum ore |
In blast furnace production, the 3D image gives the distribution and coordinates of the burden inside the furnace, so the charging process can be adjusted to form a suitable material surface shape.
FAQ
What is the volume accuracy?
≤±2%–3% of full range. Mass is calculated from volume and the density value provided by the customer on site.
Is it affected by dust?
No. Heavy dust does not affect the measurement, and the sealed antenna cover does not accumulate dust.
Can the data be sent to a PLC or DCS?
Yes. An optional output module sends material level, volume, mass or current to other control systems via RS485, MODBUS TCP or 4…20 mA. 3D point cloud data is output as PCD.
What is the opening size on the silo roof?
DN200, at about 1/4 of the silo diameter and at least 2 m from the feed inlet.
What is the process temperature range?
-25 ℃ to 75 ℃ for the standard type. Higher temperatures can be achieved with cooling accessories.
Request a Quote
Please send us the silo type and size, material and density, feed inlet location and required output signal. Our engineers will confirm the number of radars, installation location and system configuration.
Zhang Wei, possesses 20 years of experience as an automation instrumentation engineer, specializing in the research, design, installation, commissioning, and maintenance of automation instruments.
Face to various instrument communication protocols (such as Modbus, Profibus, etc.), with solid hardware circuit design and software programming skills (proficient in C language and PLC programming). Has extensive project experience; projects he has led and participated in have all achieved outstanding results, improving product accuracy, reducing costs, and increasing production efficiency.
Possesses excellent communication and coordination skills and a strong team spirit, enabling him to quickly respond to customer needs and provide high-quality automation instrumentation solutions.